Brochure
The Command Center of Your IT Environment
Automatically organize IT data from any source into service-oriented dashboards, speeding up root cause analysis and improving service delivery.
Download Brochure
In our current ‘work from anywhere’ world, Infrastructure and Operations (I&O) teams need a unified way to visualize the health and availability of key services on a 24/7 basis.
Get end-to-end visibility into the user performance of critical services such as Microsoft Office 365 to fix problems faster and meet service level agreements.
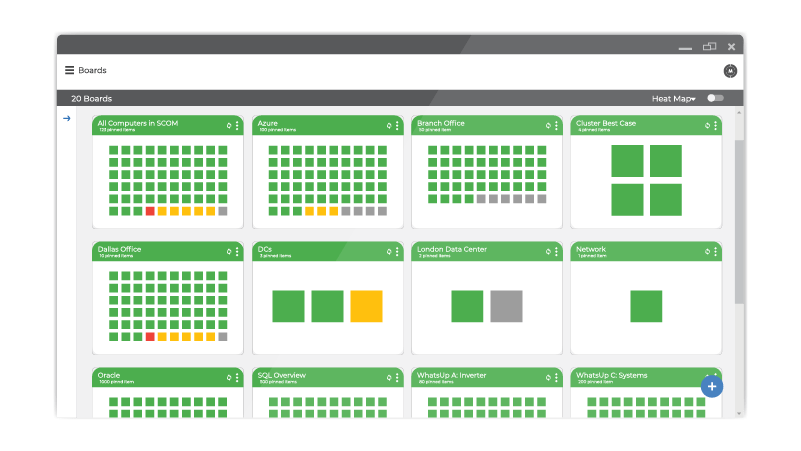
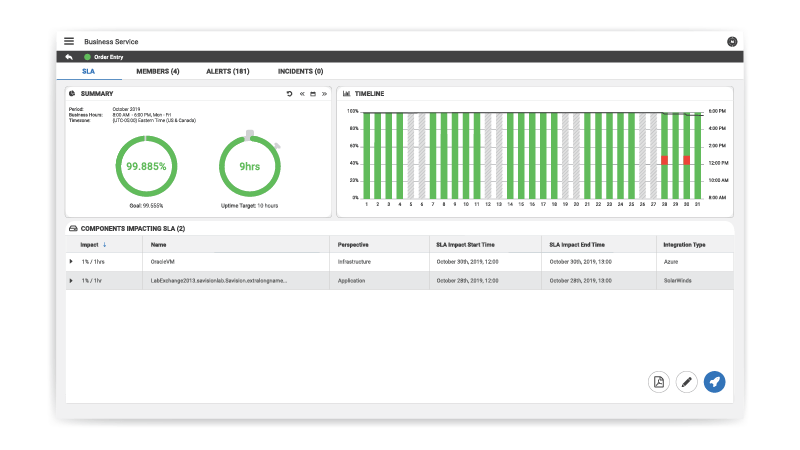
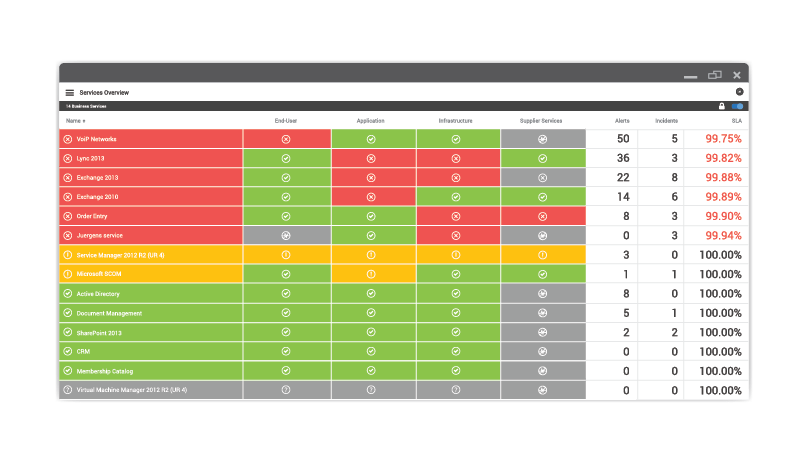
Service-oriented dashboards in Martello iQ consolidate metrics and events from multiple monitoring, IT services management, and business applications for a more comprehensive view of how critical services are performing.
Martello iQ is a digital experience analytics platform that brings together metrics and events from multiple monitoring, IT services management, business applications tools into actionable dashboards. Accessible from anywhere from any device, iQ presents a unified view of the infrastructure that supports critical business services for your company.
Simply deploy Martello iQ and data will be coming into the platform from your sources in under 10 minutes. Martello iQ operates with integrations out-of-the-box, so you’re ready to start creating your Service Dashboards immediately. Drilldowns take you from high-level visibility to detailed status and performance views of individual resources.
The real power comes when you start creating your own custom views. With Service Dashboarding you will have actionable data to understand the impact of any event on your business, without having to sift through all of the data from multiple sources. This will also offer one central location for Alert Management to consolidate alerts and ensure that the right people are receiving the right information for a faster resolution time to issues.
Martello iQ integrates with the tools your company already uses, in a hybrid cloud, on-premise, or cloud environment. With ITSM Integration, automatically notify your helpdesk through an Incident Workflow using the same tools you use today.
Unlike many of the monitoring tools you may be using, Martello iQ isn’t just for experts. Dashboards can be created and shared with anyone who needs insight into availability, performance, and reports. Share access to reports with all levels in the organization quickly and easily.
Easily associate alerts from monitoring infrastructure with incidents and help desk tickets, so IT staff can resolve incidents quickly.
Easy-to-use API for integration as an alternative to connect to additional systems.
Integrates current and future monitoring and point-solution tools to avoid disruptive re-training and lost productivity.
SCOM, Azure, Nagios, VMWare, AWS, ServiceNow, SolarWinds, PRTG.
Martello DEM puts IT teams in control of the Microsoft 365 user experience, delivering significant cost savings and productivity gains.
Prioritize reliable delivery of critical business services by unifying data from all IT management systems in a single view.
Provide a single dashboard for every service & application running on all your cloud subscriptions.
Gain end-to-end visibility of application service delivery and immediately spot the root cause of an incident.
Real-time views that display the health of IT services in terms that business stakeholders understand.

Automatically organize IT data from any source into service-oriented dashboards, speeding up root cause analysis and improving service delivery.
Download Brochure
Maintain quality and availability by adding automation to your workflows.
Download eBook